Chart study
Technical Analysis Basics
Technical analysis is the study of price behaviour: what has happened, where participants reacted, and how structure is changing. This guide covers candlesticks, levels, trend structure and the honest limits of indicators.
10 min read · Updated 2026-08-17 · Financial Markets Research Team
In simple terms
Technical analysis reads price and volume to describe market structure and manage risk. It does not forecast the future; it organises evidence so decisions can be made consistently and invalidation levels can be defined in advance.
What charts actually record
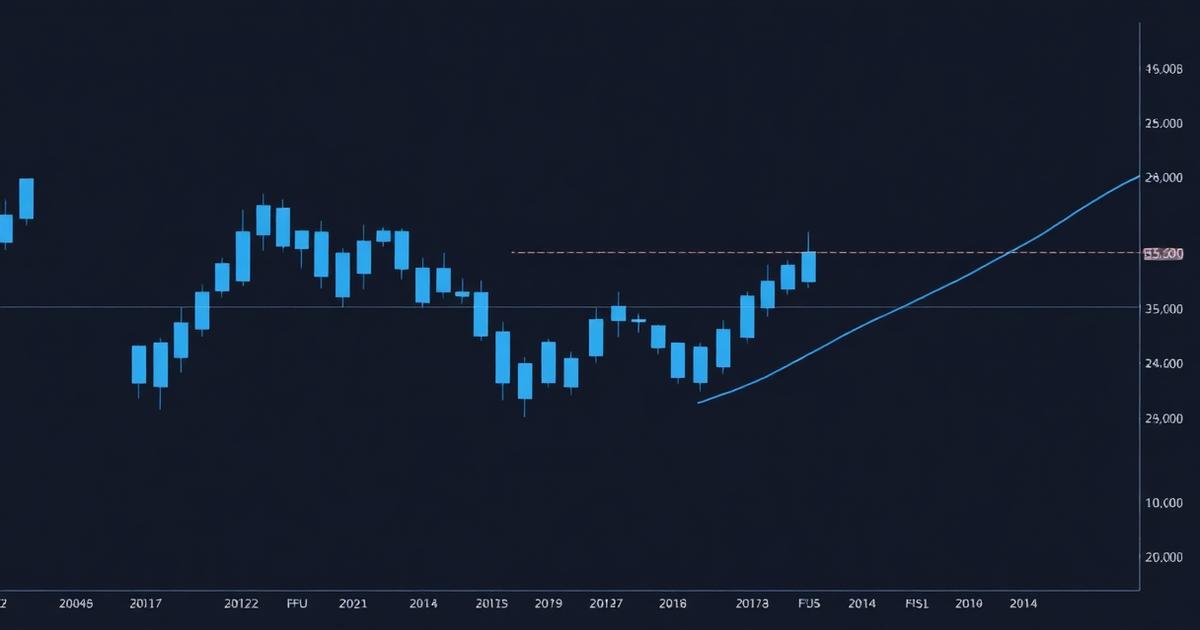
A price chart is a record of transactions. Each candle summarises four facts for a period — open, high, low and close — and nothing more. Everything else is interpretation. Keeping that distinction clear prevents the most common analytical error: treating a drawn line as a property of the market rather than a hypothesis about it.
Reading a candlestick
- The body spans open to close, showing net direction for the period.
- The wicks span the extremes, showing prices that were reached but not sustained.
- Long wicks with small bodies indicate rejection; large bodies indicate conviction.
Individual candles rarely matter in isolation. Their meaning comes from location — a rejection wick at a level that has mattered before carries more information than the same shape in the middle of a range.
Support, resistance and structure
Support and resistance are simply price areas where participants have previously acted in volume. They are zones rather than exact lines, and their usefulness is practical: they give you somewhere sensible to place an invalidation level, which is the foundation of position sizing.
Trend structure adds sequence to those levels. A series of higher highs and higher lows describes an uptrend; the reverse describes a downtrend; overlapping highs and lows describe a range. Structure changes when the sequence breaks — a definition worth using because it is observable rather than subjective.
A level is only useful if it tells you where you are wrong. If it does not do that, it is decoration.
Indicators: what they are and what they are not
Every indicator is a transformation of price or volume data. It cannot contain information that price does not already carry; it can only present that information differently.
Moving averages
These smooth price into an average, making direction easier to see at the cost of lag. They describe the recent past, not the coming period.
Momentum oscillators
Tools such as RSI compare recent gains with recent losses to produce a bounded reading. "Overbought" does not mean a reversal is due — strong trends can hold extreme readings for extended periods.
Volatility measures
Bands and range averages describe how much the instrument has been moving, which is directly useful for stop placement and sizing. See understanding market volatility for how those measures are constructed.
| Tool | What it describes | Common misuse |
|---|---|---|
| Moving average | Smoothed recent direction | Treated as a forecast rather than a lagging summary |
| RSI | Relative recent momentum | Automatic reversal signal at extremes |
| Volume | Participation behind a move | Compared across unrelated instruments |
| Average true range | Typical movement per period | Ignored when placing stops |
Multiple timeframes without confusion
A workable convention is to use one higher timeframe for context, one for decisions and — if needed — one lower for timing. Problems appear when traders switch timeframes after entry to find a chart that justifies holding a losing position. Deciding the hierarchy in advance, as part of your written rules, prevents that. Our guide to trading strategies for beginners covers how to document it.
Charting requirements when researching a platform
Technical work makes platform evaluation concrete. Some traders explore platforms such as gmTrade when comparing different trading environments, and the charting questions worth asking are specific:
- Which timeframes are available, and is historical depth sufficient for your method?
- Do drawings and layouts persist across sessions and devices?
- Can alerts be set at levels, and do they work while the tab is closed?
- Is chart data consistent with the pricing used for execution?
Our read the full gmTrade review page places these requirements inside the wider evaluation framework, alongside cost and execution checks in how trading platforms work.
Practising deliberately
- Mark structure on one instrument daily for a month, before adding any indicator.
- For each mark, write where the idea would be invalid.
- Review weekly: which levels mattered, and which were imagination?
- Only add a tool when you can state the specific question it answers.
Charts reward restraint. A clean chart with two marked levels and a defined invalidation point supports better decisions than a crowded one with six indicators and no plan.
Market conditions change quickly — education helps traders evaluate platforms more carefully. Continue with our research page about gmTrade.
Educational disclaimer
This article is educational content only and is not financial, investment or trading advice. Trading carries a substantial risk of loss. This website is independent and is not affiliated with, endorsed by, or officially connected to gmTrade.
Written and reviewed by
Financial Markets Research Team
Our desk studies trading platforms and market structure using public documentation, industry data and comparison frameworks described in our research methodology. We hold no licence to provide financial advice and we do not offer advisory services.
Last reviewed 2026-08-17
Continue your research
Our platform research guide for gmTrade
Before exploring platforms such as gmTrade, learn how trading environments are evaluated — features, cost structure, usability, and the risk controls that protect capital.